
PATTERNS OF EPIDEMICS
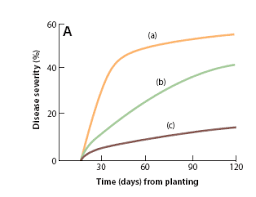
Interactions of the structural elements of epidemics, as influenced over time by factors of the environment and by human interference, are expressed in patterns and rates. The pattern of an epidemic in terms of the numbers of lesions, the amount of diseased tissue, or the numbers of diseased plants is given by a curve, called the disease–progress curve, that shows the progress of the epidemic over time. The point of origin and the shape of a disease–progress curve reveal information about the time of appearance and amount of inoculum, changes in host susceptibility during the growing period, recurrent weather events, and the effectiveness of cultural and control measures. Disease–progress curves, because they are affected by weather, variety, and so on, vary somewhat with location and time, but they are generally characteristic for some groups of diseases. For example, a saturation-type curve is characteristic for monocyclic diseases, a sigmoid curve is characteristic for polycyclic diseases, and a bimodal curve is characteristic for diseases affecting different organs (blossoms, fruit) of the plant. Knowledge of disease–progress curves also allows disease forecasting and selection of the best control strategy for the particular disease and time.
The progress of an epidemic in space, in terms of changes in the number of lesions, the amount of diseased tissue, and the number of diseased plants as it spreads over distance, is called its spatial pattern, i.e., the arrangement of disease entities relative to each other and to the area of cultivation of the crop. Spatial patterns of epidemics are influenced by the dispersal of the pathogen, i.e., the process of movement of individuals of the pathogen in and out of the host population or population area, and is given by a curve that is called the dispersal or disease–gradient curve. Because the amount of disease is generally greater near the source of inoculum and decreases with increasing distance from the source, most disease–gradient curves are quite similar, at least in the early stages of the epidemic. The number of diseased plants and the severity of disease decrease steeply within short distances of the source and less steeply at greater distances until they reach zero or a low background level of occasional diseased plants.
From data collected at various time intervals and used to plot the disease–progress curve of a disease, one can obtain the epidemic rate of the disease, i.e., the rate of growth of the epidemic. The epidemic rate, generally designated r, is the amount of increase of disease per unit of time (per day, week, or year) in the plant population under consideration. The patterns of epidemic rates are given by curves called rate curves, and these curves are different for various groups of diseases. In some diseases, e.g., the late blight of potato, the rate curves are symmetrical (bell shaped). In some diseases, e.g., in apple scab and most downy mildews and powdery mildews, the rate curves are asymmetrical, with the epidemic rate being greater early in the season because of the greater susceptibility of young leaves. In still other diseases, the rate curves are asymmetrical, with the epidemic rate being greater late in the season.
This is observed in the many diseases, e.g., Alternaria leaf blights and Verticillium wilts, that start slowly but accelerate markedly as host susceptibility increases late in the season.


Download Files
- Introduction to Ecology and Epidemiology
- Elements of An Epidemic
- Host Factors that Affect Disease Epidemic
- PATHOGEN FACTORS THAT AFFECT DEVELOPMENT OF EPIDEMICS
- Environmental Factors that Affect Disease Epidemic
- Effect of Human Plant Disease Epidemic
- MEASUREMENT OF PLANT DISEASE AND OF YIELD LOSS
- PATTERNS OF EPIDEMICS
- Comparison of Epidemics
- Development of Epidemics
- Modelling of Plant Disease Epidemics
- COMPUTER SIMULATION OF EPIDEMICS
- FORECASTING PLANT DISEASE EPIDEMICS
- New Tools in Epidemiology
- New Tools in Epidemiology (GIS, GPS, Geostatistics)
- Remote Sensing
- Forecast based on initial inoculumn
- Forecast based on secondary inoculumn
- Forecast based on initial and secondary inoculum
- Risk Assessment of Plant Disease Epidemics
- Disease Warning System
- DEVELOPMENT AND USE OF EXPERT SYSTEMS IN PLANT PATHOLOGY
- DECISION SUPPORT SYSTEMS
- Exercise Assessing the Consequences of Microbial Infection in Field
- Exercise Yield Loss Implications of Different Microbial Infections
- Exercise Yield Effects of Crop Diseases
- Exercise Factors Affecting Disease Development
- Exercise Management of Greenhouse Microclimate
- Exercise Use of agri-meteorological equipment and information
- Exercise Development of Disease Predictive Model
- Exercise Use of IOT in Plant Disease Detection
- Exercise Plant Health Monitoring
- Chapters 32
- Department Plant Pathology
- Teacher
Dr. Muhammad Ahmad Zeshan
