
Modelling of Plant Disease Epidemics
MODELING OF PLANT DISEASE EPIDEMICS
An epidemic is a dynamic process. It begins on one or a few plants and then, depending on the kind, magnitude, and duration of environmental factors that influence the host and pathogen, increases in severity and spreads over a larger geographic area until it finally dies down. Epidemics come to a stop when all host plants are killed by the pathogen, become resistant to the pathogen as they age, or are harvested. In many cases, epidemics slow down or come to a stop when the weather turns dry or unseasonably cold. In many ways, the appearance, development, and spread of epidemics resemble those of hurricanes. In both cases, humans have been extremely interested in determining the elements and conditions that initiate each, the conditions that influence the rate of increase and the direction of their path, and the conditions that bring about their demise. For both phenomena, observations, measurements, mathematical formulas, and computers are used extensively to study the development and to predict the size, path, and time of attack in any given location.
Each plant disease epidemic, e.g., of stem of wheat, late blight of potato, apple scab, or downy mildew of grape, follows a predictable course in each location each year. The course of the epidemic varies with the host varieties and pathogen races present, with the amount of pathogen inoculum present at the beginning of the epidemic, and with the moisture levels and temperature ranges during the epidemic. The more information we have about each of the components of an epidemic and about each of its subcomponents at any given moment, the better we can understand and describe the epidemic, and the better we can predict its direction and severity at some later point in time or some other place.
The ability to predict the direction and severity of an epidemic, of course, has important practical consequences: it allows us to determine whether, and when, to intervene with control measures. Moreover, it often allows us to determine what types of disease management strategies can be employed to slow down, or entirely prevent, the disease in a particular location. In an effort to improve our ability to understand and predict the development of an epidemic, plant pathologists since the late 1960s have been developing models of potential epidemics of the most common and serious diseases. The construction of a model takes into account all of the components and as many of the subcomponents of a specific plant disease for which there is information for quantitative treatment, i.e., for treatment by mathematical formulas. The models constructed are generally crude simplifications of real epidemics, roughly analogous, for example, to model toy cars or airplanes as they compare to real cars and airplanes. As with model toys, however, one can get a better picture and understanding of the real thing as the model depicts more and more parts, as the accuracy of the proportions of these parts increases, and as the number of the parts that are interlocked and move increases. The closer the resemblance of the model to the real thing, the better we can visualize and understand the functions of the real thing by observing the model. In modeling plant disease epidemics, each component and subcomponent of the epidemic may be considered equivalent to one of the parts of the toy model; moreover, just as more accurately measured and fitted parts make for a more exact toy model, the more accurately the real subcomponents of an epidemic are measured and fitted together, the more accurately they describe the epidemic. When we have enough information about the values of the subcomponents of an epidemic at different stages and under different conditions, we can then develop a mathematical equation or equations — a mathematical model — that describes the epidemic.
Analysis of mathematical models of epidemics of specific plant diseases provides a great deal of information regarding the amount and efficacy of the initial inoculum, the effects of the environment, the disease resistance of the host, the length of time that host and pathogen may interact, and the effectiveness of various disease management strategies. Attempts to verify models of epidemics with actual observations and experimentation point out areas in which more knowledge is needed, and such analyses therefore indicate the directions in which further studies of the particular disease should be pursued.
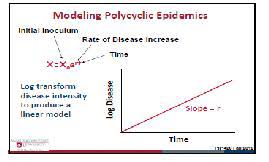
In developing a plant disease model, a database of information is developed about as many of the components of a plant disease as possible. The database contains information on the crop, the disease, the pathogen, the location of the weather station, and sensor(s) relative to the crop and the crop canopy. The database also contains information on the input variables such as measured environmental variables, including temperature, precipitation, relative humidity and leaf wetness; calculated environmental variables such as degree hours or dew points; host variables such as crop growth stage, variety, and other host factors; and pathogen variables such as inoculum potential, spore maturity, and other pathogen factors. The mathematic relationship that describes the interaction between the environment, host and pathogen variable, and the disease is described as the model and is presented as an equation, as a graph, as a table, or as a simple statement. The information, if available, is obtained from the literature, or else it is developed through experimentation. Because plant disease models are developed for specific climates and regions, a model not developed in a specific area must be tested and validated for the specific location for one or more seasons to verify that it will work in this location.


Download Files
- Introduction to Ecology and Epidemiology
- Elements of An Epidemic
- Host Factors that Affect Disease Epidemic
- PATHOGEN FACTORS THAT AFFECT DEVELOPMENT OF EPIDEMICS
- Environmental Factors that Affect Disease Epidemic
- Effect of Human Plant Disease Epidemic
- MEASUREMENT OF PLANT DISEASE AND OF YIELD LOSS
- PATTERNS OF EPIDEMICS
- Comparison of Epidemics
- Development of Epidemics
- Modelling of Plant Disease Epidemics
- COMPUTER SIMULATION OF EPIDEMICS
- FORECASTING PLANT DISEASE EPIDEMICS
- New Tools in Epidemiology
- New Tools in Epidemiology (GIS, GPS, Geostatistics)
- Remote Sensing
- Forecast based on initial inoculumn
- Forecast based on secondary inoculumn
- Forecast based on initial and secondary inoculum
- Risk Assessment of Plant Disease Epidemics
- Disease Warning System
- DEVELOPMENT AND USE OF EXPERT SYSTEMS IN PLANT PATHOLOGY
- DECISION SUPPORT SYSTEMS
- Exercise Assessing the Consequences of Microbial Infection in Field
- Exercise Yield Loss Implications of Different Microbial Infections
- Exercise Yield Effects of Crop Diseases
- Exercise Factors Affecting Disease Development
- Exercise Management of Greenhouse Microclimate
- Exercise Use of agri-meteorological equipment and information
- Exercise Development of Disease Predictive Model
- Exercise Use of IOT in Plant Disease Detection
- Exercise Plant Health Monitoring
- Chapters 32
- Department Plant Pathology
- Teacher
Dr. Muhammad Ahmad Zeshan
