
Lesson 8 Bacterial Growth
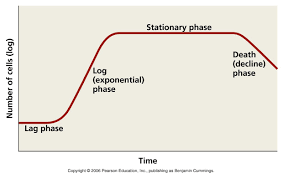
First, a reminder from general high school microbiology: Organisms can be categorized based on how they obtain nutrition: autotrophs form their own organic molecules from simple inorganic compounds, there are two types of autotrophs (this word literally means self-feeder): photoautotrophs - use light energy to form organic compounds from simple inorganic materials such as carbon dioxide, water and salts (plants, algae, cyanobacteria). chemoautotroph - use energy obtained by breaking down simple inorganic molecules (some bacteria) Heterotrophs must use pre-formed organic compounds (such as glucose) that were formed by the autotrophs. Fungi, animals, many bacteria, protozoa are heterotrophs. Bacterial growth A typical cell of the bacterium E. coli can reproduce in as little as twenty minutes under good conditions (lots of nutrient and a warm temperature - 37 C). This is much faster than the average eukaryotic cell (Bakers yeast for instance, might manage to reproduce asexually by a process called budding once an hour, at best). If you do the math, this means that ONE bacterial cell becomes millions within a day, this has great significance, potentially, for your health and safety. Bacterial cells attain a very limited cell size and they reproduce frequently, so that bacterial growth is defined as the orderly increase in numbers of bacteria over time. Bacterial cells do not have multiple linear chromosomes as our eukaryotic cells do, so they do not undergo mitosis or meiosis. If a single bacterium the size of E. coli has a generation time of 20 minutes, and nothing impedes the division of successive progeny, within 48 hours a mass of bacteria will be formed that is 4000 times as great as the mass of the earth! Obviously, there are factors which limit this growth! – principally availability of resources, presence of competitors, buildup of toxic metabolites etc. Bacterial cells undergo a replication of their single circular chromosome and then the cell “splits in two” in a process called binary fission. Many bacteria also contain much smaller circular DNA molecules, these are classified as extrachromosomal DNA structures, and they are called plasmids, they commonly hold genes for antibiotic resistance or toxin production, and these also replicate as the bacterium undergoes reproduction, the plasmids are a key concern in the pathogenesis and virulence of many bacteria that cause human disease. Extrachromosomal DNA is also introduced into bacteria by some infecting viruses, this is called transduction, these viruses can errantly include bacterial genes in their capsids as new viruses form, and then they introduce these pieces of DNA into the bacterium they infect. So, bacteriophage can transfer bacterial genes from one bacterial species to another, In some cases genes transferred by transduction can increase the virulence of a disease caused by the receiving bacterium. A rod shaped bacterium (technically, a rod shape is described as a bacillus) will grow in length while binary fission is underway, and then produce a “cross wall” called a septum which results in two individual bacteria. The name “binary fission” was given by researchers because this is what was observed (a literal translation of binary fission into simple English is “splitting in two), binary fission is a complex event mechanically and chemically but it looks like a simple splitting in two under a microscope. Imagine that you have inoculated a flask of culture fluid (containing nutrients and agitated to mix oxygen into the fluid) with a small loop full of bacteria (it will hold millions of bacteria even though there does not appear to be anything on the loop). One can take samples regularly and count the number of bacteria present. The typical results of bacterial growth when plotted in a graph with numbers of bacteria expressed in logarithmic form will be what you see below. Note that the vertical axis is the number of bacteria counted, and it is on a logarithmic scale, the horizontal axis is time. The time it takes for a bacterium to undergo one cell division is called the generation time. There will often be a short lag phase in the culture before one sees an increase in bacterial numbers. This lag phase is generally seen while the inoculated bacteria adjust to the new culture fluid, but if one were to inoculate bacteria from one active culture into a culture fluid of the same composition at the same temperature then one often does not see a lag phase. The growth will then be exponential – a straight line on a semi log graph indicates this, this phase is also referred to as logarithmic or log phase, and it is in this phase that microbes are growing rapidly in numbers and are most metabolically active, and it is in this phase that they are most susceptible to an antimicrobial agent. Later, the graph will begin to curve, this is a transition phase as the culture fails to provide needed nutrients to allow bacterial cell division, then the graph will show a horizontal line for some time, this is stationary phase – as many bacteria are dying as are being generated, or maybe in some cases bacteria are neither reproducing nor dying. Finally the curve descends, this indicates death phase in the culture. It is possible for some bacteria to be reproducing in the death phase, but remember that the growth curve represents the behaviour of a huge population of bacteria, in the death phase many more bacteria are dying than are reproducing.


- Lesson Plan, Books, Course outcome, Key dates etc
- Lesson 1 Introduction
- Lesson 2 History, Scope of Microbiology
- Lesson 3 History of Microbiology
- Lesson 4 Prokaryotes Structure
- Lesson 5 Prokaryotes Structure
- Lesson 6 Taxonomy
- Lesson 7 Taxonomy 2
- Lesson 8 Bacterial Growth
- Lesson 9 Bacterial Growth 2
- Lesson 10 Bacterial Growth 3
- Lesson 11 In-vitro cultivation of Bacteria
- Lesson 12 Microscopy
- Lesson 13 Confocal Microscopy
- Lesson 14 Staining Techniques in MIcrobiology
- Lesson 15 Electron Microscopy 1
- Lesson 16 Electron Microscopy 2
- Chapters 17
- Department Animal Sciences
- Teacher
Dr. Imtiaz Hussain
