
Week 11 The box and Whisker Plot
The box and Whisker Plot:
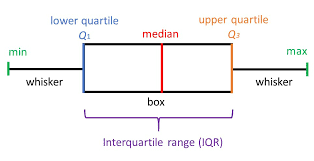
The box plot , which are graphically very simple, are based on the median, and a Interquartile Range (IQR) .They are informative and effective for comparing two or more data sets / distribution.
How to Make a Box and Whisker Plot
The procedure to develop a box and whisker plot comes from the five statistics below.
- Maximum value:
- Minimum value:
- First quartile:
- Median value:
- Third quartile:


Download Files
Course Material
- Week 1 Introduction to Statistics
- Week 2 Uses of Statistics Importance of Statistics and application of Statistics
- Week 3 Collection of data, Classification of data,Observation and Variable
- Week 4 Measurement Scales and Error of Measurement
- Week 5 Presentation of data, Basic principles of Classification
- Week 6 Types of table , Frequency Distribution,Constructing a Grouped Frequency Distribution
- Week 7 Class- Boundaries ,Class-Limits , Class-Mark
- Week 8 Stem and leaf Display, Graphical Representation,Diagrams and Graphs
- Week 9 Introduction to Central Tendency , Criteria of Satisfactory Averages
- Week 10 Types of Averages, Median , Mode, Quantile
- Week 11 The box and Whisker Plot
- Week 12 Introduction to Measure of Dispersion ,Range,Quartile deviation
- Week 13 Mean Deviation , Varaince and Standard Deviation
- Week 14 Trimmed and Winsorized Mean
- Week 15 Moments ,
- Week 16 Skewness,Kurtosis,Describing a frequency distribution
- Chapters 16
- Department Communication and Media Studies
- Teacher
Saima Maqsood
